Introduction of Line Graph maker
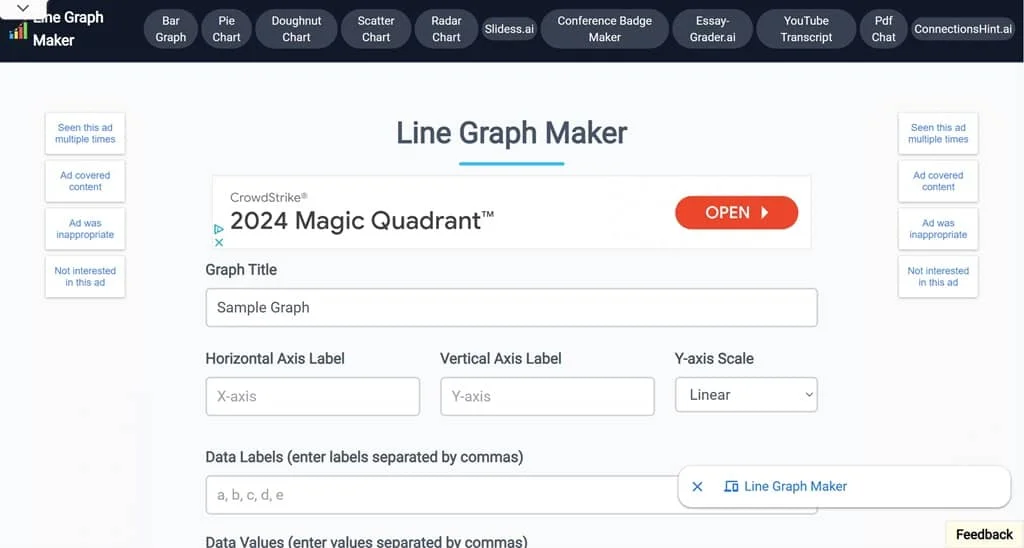
Line Graph Maker is an online line chart maker designed specifically to create linear charts quickly. Users just need to follow simple steps to customize chart titles and axis labels to generate professional line graphs. This AI tool also allows users to customize the appearance of the chart, including line tension, title position and gridline settings. Once completed, the generated chart can be downloaded in JPG or PNG format. As an advanced online data visualization tool, Line Graph Maker can easily help you visualize your data, whether you are a student, teacher or data analyst.
Core Features of Line Graph Maker
1. Easy to use, easy to create line charts.
Users only need to enter the chart title, axis labels and data, and the tool will automatically generate line charts without specialized skills.
2. Highly customizable.
Users can adjust the line tension, icon title position and grid line settings according to their needs to achieve a high degree of customization.
3. Multi-format export support.
Users can download the line diagram as JPG, PNG or SVG format for easy use.
4. Real-time preview.
When entering data and setting parameters, users can view the chart changes in real time.
Use Cases of Line Graph Maker
- Business Analytics. Users can use this data visualization tool to display data such as sales trends, market changes, and other data to make the data more intuitive.
- Education Teaching. Teachers can use the tool to create charts and graphs in the classroom to explain complex concepts or data more visually.
使用分步指南
1.访问官方网站。
- Go to Line Graph Maker official website.
2. Input data.
- Input your data line by line in the specified input box.
3. Set chart parameters.
- Enter the title, axis labels, and other parameters.
- Adjust the line color, style and other styles as required.
4. Real-time preview.
- While entering data and adjusting parameters, you can view the generated chart in real time.
5. Download Chart.
- Choose to download the chart in JPG, JPG or SVG format.
定价
- 免费使用。
常见问题
1. What is Line Graph Maker?
It is an online icon maker tool designed to help users quickly create professional linear charts to visualize data trends.
2. What formats are supported for data entry?
Users can manually enter data, usually in the form of numbers and labels.
3. Can I customize the charts?
Yes. Users can customize the title, axis labels, line color, style and thickness of the chart.
4. Can it be used on mobile devices?
This is a web-based tool that can be accessed on a variety of devices, including desktop computers, tablets, and cell phones.
5. How can I get help or support?
If users encounter problems during use, they can get support through the contact information provided on the official website or the help center.


发表回复